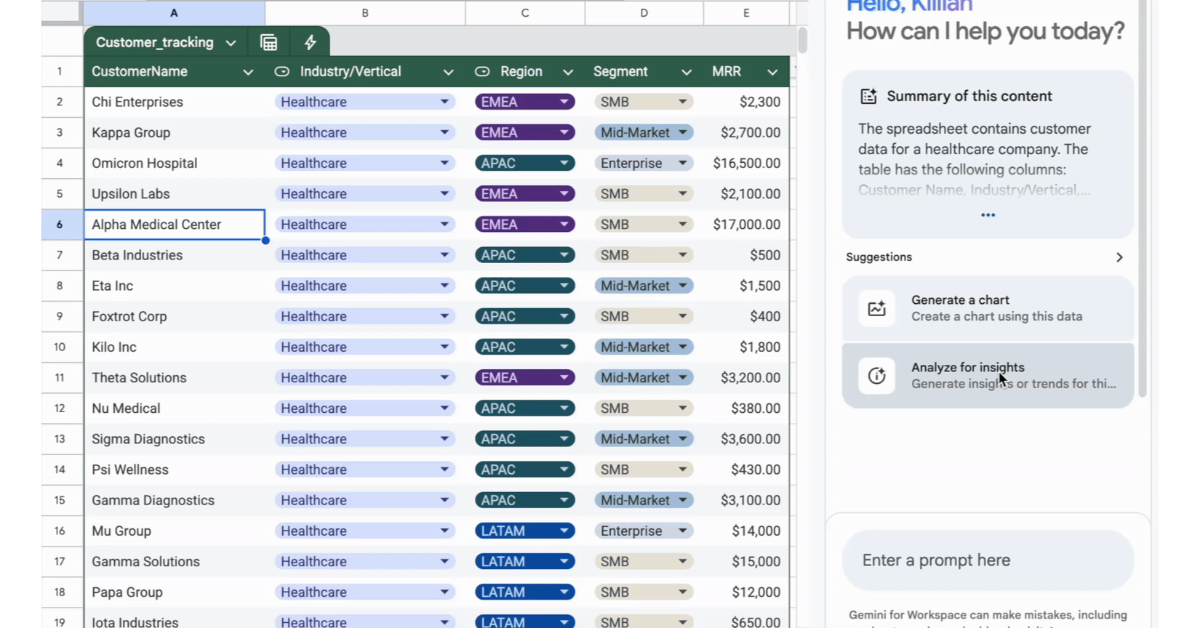
Google Sheets is getting a significant update that will allow the AI tool, Gemini, to analyse and visualise user data. The upgrade is available to Google Workspace members as well as Google One AI Premium plan holders. Gemini can now turn user prompts into Python code, find contextual trends, patterns, and correlations, and make charts using user data.
“Building data visualizations and identifying trends in data is a critical business function, however, it can be time-consuming and oftentimes overwhelming. To improve upon this experience, we’re making it easier for Sheets users, ranging from small business owners to marketing analysts, to visualize and analyze data using Gemini in Sheets,” the company said in a blog post.
Gemini in Sheets has boosted its intelligence by converting requests into Python code, running them, and analysing the results for multi-layered analyses. According to the company, this will allow users to quickly find top-performing products and evaluate their sales trends without having to write a single line of code.
Also Read: Netflix enabled the Season Download button for all iPhone and iPad users
Therefore, with the new upgrade, Gemini in Sheets can conduct actions or answer questions to address a variety of contexts, offering information such as contextual trends, patterns, and variable correlations. Moreover, it can also create charts from your data and insert them as static images over cells in your spreadsheet. A marketing manager can request insights on their top three channels based on conversion rate, a small business owner can use historical data to predict net income for the next quarter, and a financial analyst can look for anomalies in inventory levels for a product to identify supply chain issues or unusual demand trends.
Make sure your data is consistent, has clear headers, and has no missing values for more reliable results. Gemini in Sheets is said to perform best in files with fewer than one million cells, so be particular when you ask it to examine your data. Gemini in Sheets may use formulas instead of Python code to handle basic data queries. Charts can be added to your sheet and are created as static images, but they cannot be changed and are not connected to the data on your sheet.
To access Gemini in the Workspace apps’ side panel, Admins must enable smart features and personalization. Users can set default settings in the Admin console. End users can access Gemini for Sheets by clicking the “Ask Gemini” button in the top right corner of Sheets.


